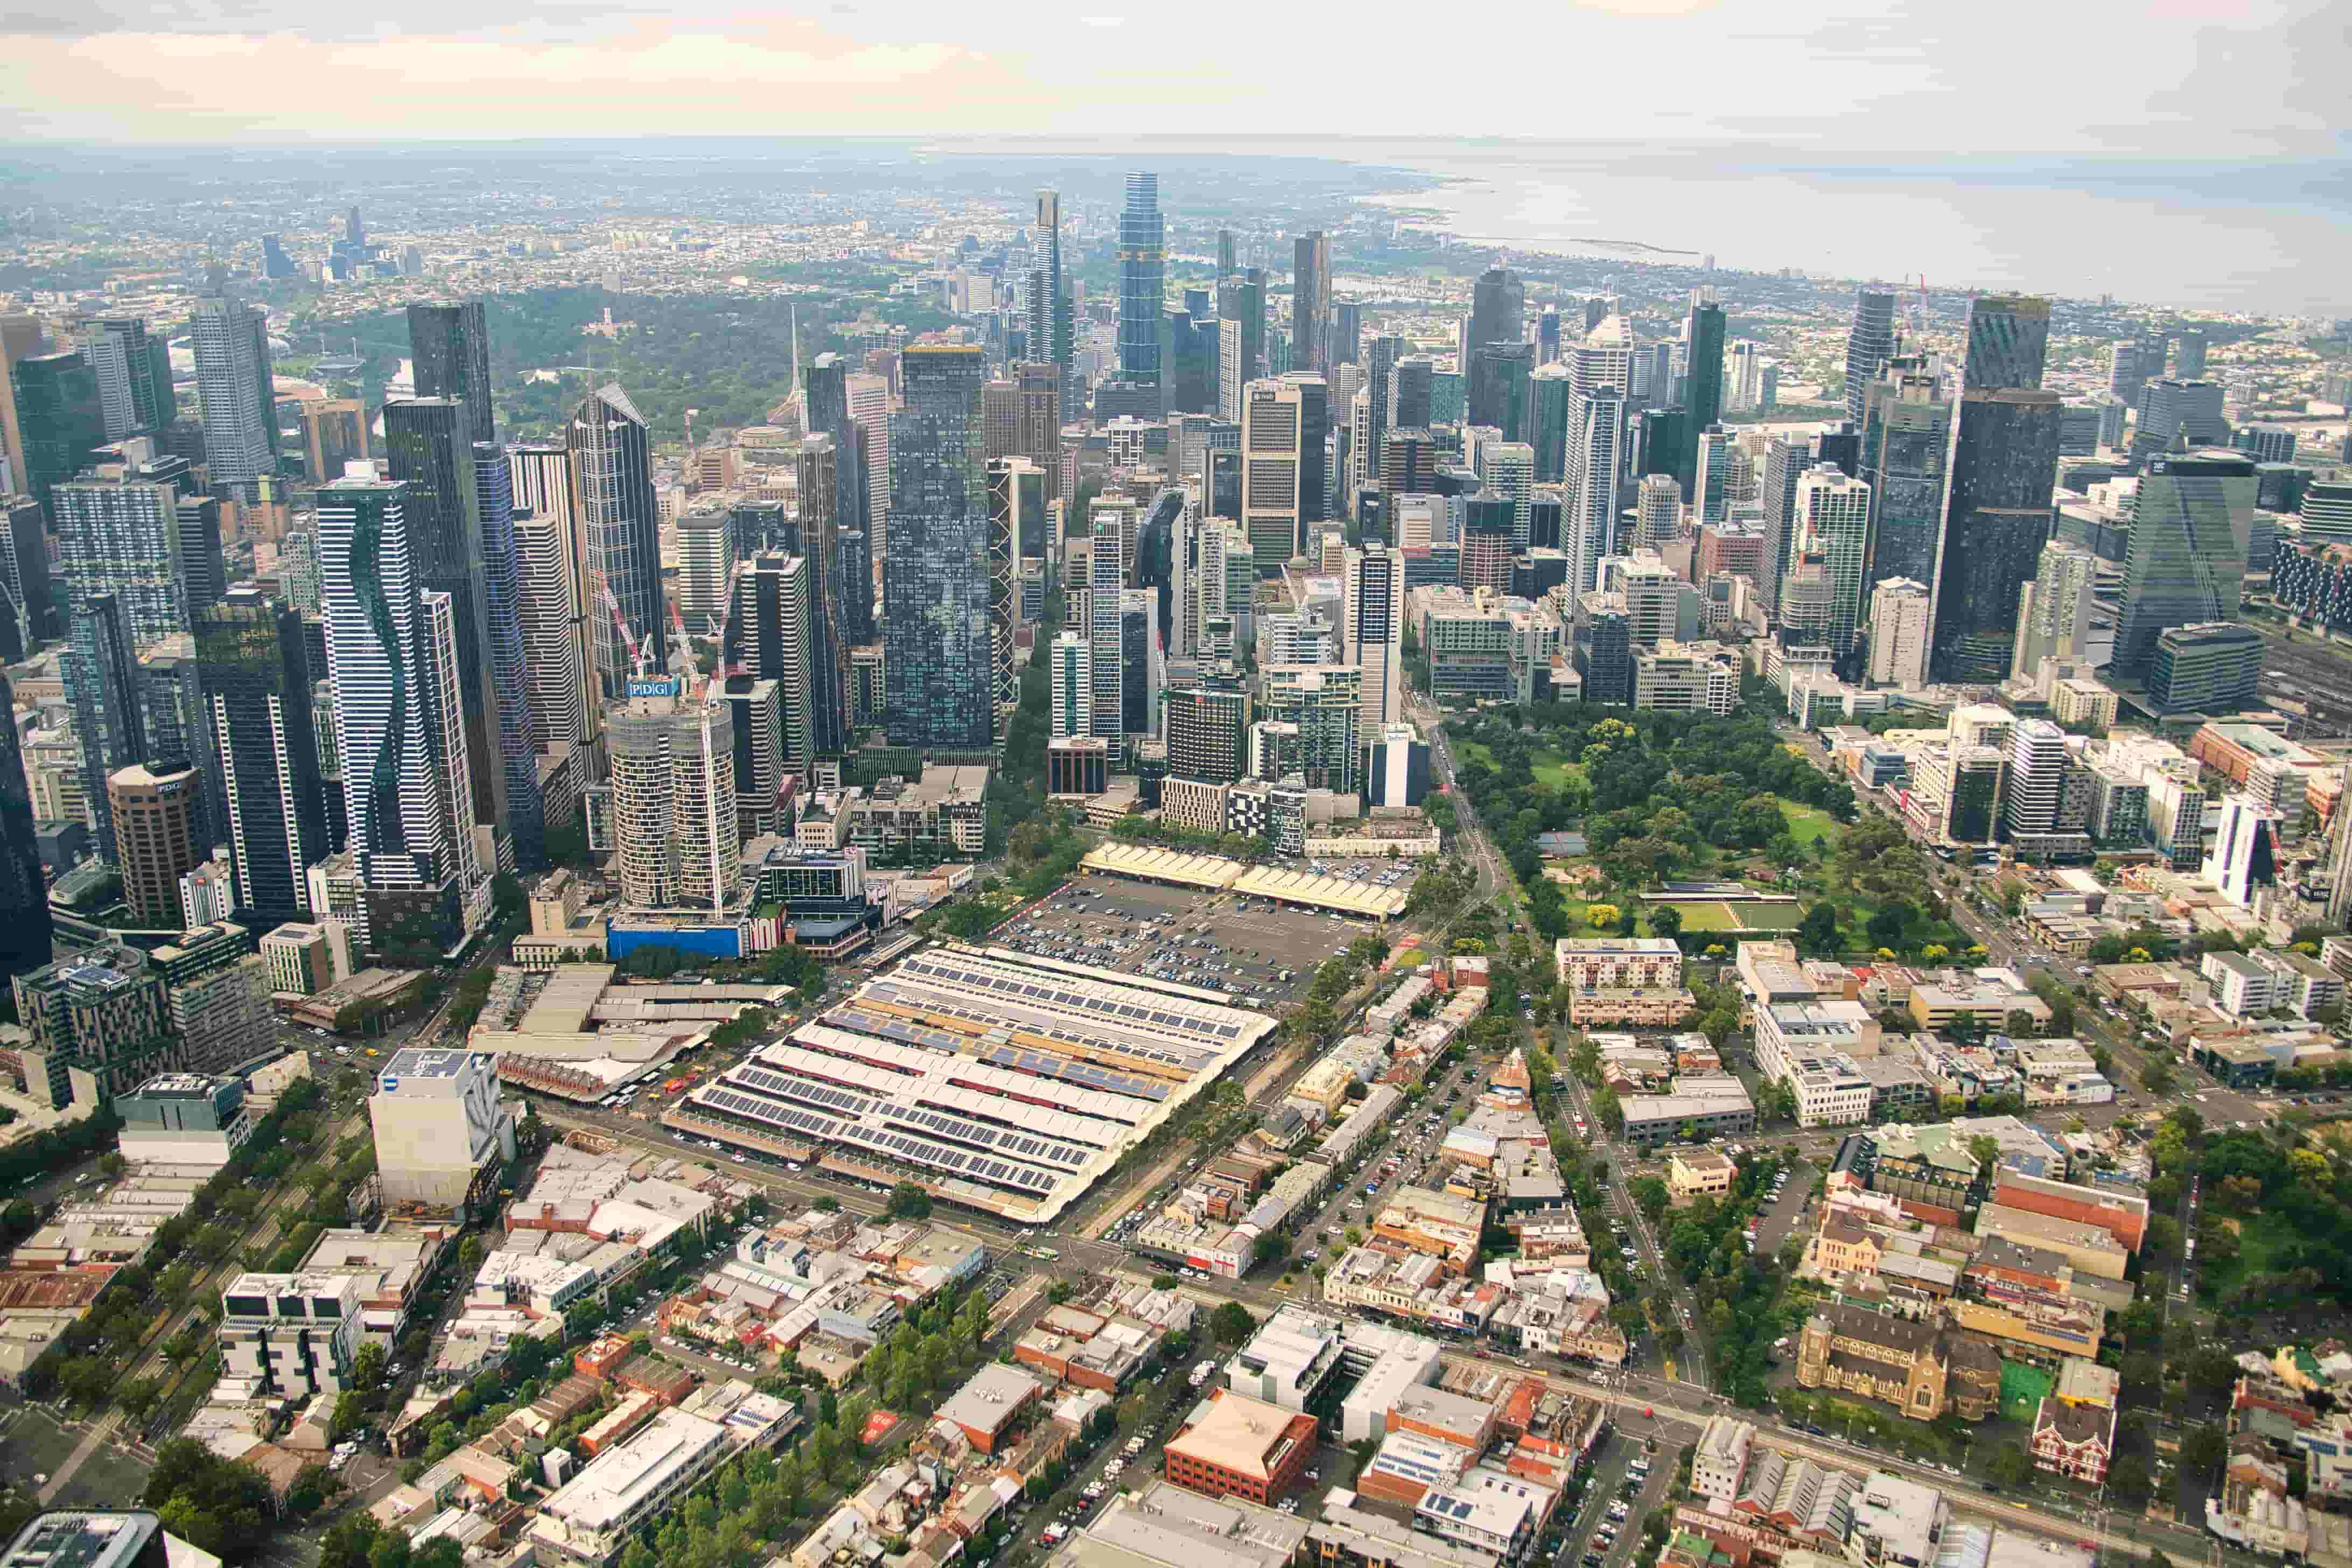
The 2026-27 budget reads like a map
The Victorian Government has handed down its 2026-27 Budget under the banner of Easier. Safer. More Affordable. Treasurer Jaclyn Symes framed it as immediate cost-of-living relief paired with long-term investment — half-price public transport fares for the rest of the year, a 20% discount on car registration, and billions of dollars of new spending across health, education, transport, and housing.
Strip away the political framing and the headline numbers, and what's left is a geography. Every dollar in this budget lands somewhere on a map. New trains arrive at specific stations. New homes are built in specific suburbs. New TAFE Centres of Excellence open in specific buildings on specific streets. Schools get upgraded in specific postcodes; hospitals get expanded in specific catchments.
For a household trying to decide where to live, that geography isn't a side detail — it's the point. The 2026-27 Victorian Budget is, more than anything else, a statement about where Victoria's liveability is heading over the next decade.
This post walks through what the budget actually funds, where it lands, and why a map of amenities and walkability — the kind geoscore.com.au builds for every Australian address — has never mattered more in deciding where to live.
Trains, trams, buses and a $1.3 billion public-transport package
The headline transport spend is significant. Inside the Making Life Easier priority area, the budget commits roughly $1.3 billion across rail. The single largest line item is $674 million for 25 new six-car X'Trapolis 2.0 trains for the metropolitan network. There's $76 million to electrify the Melton Line, $92 million to lift services across the regional network — including up to nine daily Shepparton services and capacity uplift on the Wyndham Vale Line — and a continuation of the level-crossing removal program, with 110 crossings now removed, unlocking more frequent peak-hour services across Melbourne.
Suburban and regional bus and ferry services pick up another $105 million, targeting growing suburbs and regional centres. The tram network — already the world's largest — gets $76 million for new accessible stops. And a smaller but telling line item, $7.5 million, is going specifically into safer cycling facilities and walking paths.
Public transport investment doesn't show up evenly across a city. Melton residents will feel an electrified line very differently than residents three suburbs to the east. A new bus route in a growth corridor changes the daily-commute calculus for the households inside its catchment, and largely no one else's. Level-crossing removals add capacity on specific corridors — and the suburbs sitting on those corridors are the ones whose practical transport quality quietly improves.
The Treasurer's own framing of the budget — "slashing the cost of catching a train and driving your car" — is honest about the trade-off households are making. Rising fuel prices mean public transport access is no longer a lifestyle preference; it's a household budget line. And public transport access is intensely local: it's measured at the front door, not the suburb.
All of this is the kind of thing that's invisible if you read the budget line-by-line, but visible the moment you put it on a map. geoscore.com.au already scores every Australian address against transport amenities — train stations, tram stops, bus routes, cycling infrastructure — and tracks walking time to each. As these new services come online, the scores attached to specific addresses will shift, and a household weighing two suburbs side by side will be able to see the difference.
Where the new homes are going
Housing supply is the second leg of the budget's liveability play. The Making Life More Affordable chapter commits $860 million over five years to the Social Housing Growth Fund, targeting more than 7,000 new social homes over the next decade. Another $207 million backs broader affordable housing, $97 million goes to housing reform and building-industry confidence, and the $10,000 First Home Owner Grant is preserved alongside continued stamp-duty concessions.
Land supply gets its own $37 million envelope: $16 million for Melbourne's ten-year greenfields plan, $11 million to modernise planning legislation, and $9.8 million for the Development Facilitation Program, which fast-tracks priority housing projects.
The largest housing lever in the budget, though, isn't in the housing chapter — it's in transport. Tunnelling on the Suburban Rail Loop begins in 2026, and the government is now describing it explicitly as "Australia's biggest housing project," with stage one projected to deliver around 70,000 new homes over thirty years in the precincts around its stations.
This is the central insight of the budget: housing supply and transport supply are being treated as the same problem. New homes are being directed toward places that already have, or will soon have, real connectivity. Greenfields growth is being paired with the buses and trains that make those suburbs livable on day one rather than year ten.
For anyone choosing a home, that integration matters. A house in a growth suburb that sits 800 metres from a planned train station is a fundamentally different proposition than the same house three kilometres further out. Walking distance to the new amenity — not just its existence — is what determines whether a household can actually use it on a Tuesday morning. That kind of address-level walking-time analysis is exactly what geoscore profiles surface, with walk times and feature cards laid out around any property in Australia.
It also points to why a single number — a "score" or a "rating" — was never going to be enough to describe a neighbourhood. Different households need different things from the same suburb. A young couple buying near a new SRL station may care most about cafes within five minutes and a train within ten. A family moving to a regional centre may care about schools, parks of a meaningful size, and a supermarket inside walking range. geoscore's walkability search is built around exactly that kind of multi-criteria filtering — minimum walk time to the nearest feature, count of features inside a chosen radius, and area thresholds for size-sensitive amenities like parks. Budgets fund infrastructure; households decide what infrastructure they actually need to live well.
Jobs at addresses, not abstractions
The Backing Businesses and Workers chapter is where the budget connects people to jobs in a literal, geographic way.
Free TAFE gets $459 million and another 59,000 places. More importantly for the geography of opportunity, three new TAFE Centres of Excellence are funded at specific addresses:
- A $30 million Digital, AI and Technology Centre at Chisholm Institute in Frankston.
- A $21 million Home and Community Care Centre at Holmesglen Institute.
- A $50 million Victorian Renewable Energy Centre at TAFE Gippsland in Morwell, with satellite hubs in Ballarat and Warrnambool.
Add an $8.2 million AI career-conversion program for workers transitioning out of automation-exposed industries, and the budget is pointing — quite specifically — to the places where the next generation of skilled jobs will be trained and hired.
For a household making a long-term decision about where to live, those addresses aren't trivia. A home within reasonable transport distance of a new Centre of Excellence is also a home with a structural advantage in the local labour market. A child growing up walking distance to an upgraded school sits inside a different opportunity envelope than a child two suburbs away. The budget is drawing that geography; the question for residents is whether they can see it.
geoscore's category scoring covers Education, Transport, Health, Shopping, Gastronomy, Entertainment, Nature, and general Amenities — all of it benchmarked against the suburb, the local government area, and the city. As new institutions open and existing schools are upgraded, the scores in the suburbs around them shift. The budget is, in effect, a forward-looking input to that map.
Regional Victoria gets a transport-and-housing pairing of its own
The Regional Victoria, the Place to Be chapter mirrors the metro story at a different scale. Regional transport gets $481 million in total — $318 million for rail upgrades, $127 million for freight rail, $73 million for road upgrades across eleven specific projects, $30 million for additional Shepparton-line services, and $3.9 million to keep the Portarlington ferry running.
On housing, $1 billion is committed to deliver more than 1,300 social and affordable homes regionally by June 2028, with another $1.25 billion flowing into regional areas through the Big Housing Build. Education gets $112 million, including $95 million to upgrade nine specific regional schools — Ararat Primary, Bacchus Marsh College, Daylesford Primary, Eaglehawk Primary, Maryborough Education Centre, Stawell Primary, Surfside Primary, Warragul North Primary, and Yarrawonga College. Health gets a $75 million Regional Health Infrastructure Fund and major redevelopments at Ballarat Base, Barwon Women's and Children's, and Warrnambool Base.
Regional employment, the budget notes, has grown 23.1% over the past decade, and around 23% of Victorians now live outside metropolitan Melbourne. Each of those regional dollars lands somewhere specific. A household considering a sea change to Geelong, a tree change to the Macedon Ranges, or a long-overdue move to Ballarat is making a decision about which of those specific places will be measurably better to live in five years from now.
That decision is hard to make from a real-estate listing. It's much easier to make when you can see, for any candidate address, how walkable the local town centre is, how close the upgraded school is, what the transport options look like, and how the area scores against comparable suburbs. That's the gap geoscore is built to close — and the budget makes it more important to close, not less.
The map is the message
If there's a single throughline across the 2026-27 Victorian Budget, it's that the government is not just funding services — it's redrawing the map of where in Victoria life is most liveable, most connected, and most affordable. New trains, new homes, new TAFE campuses, upgraded schools, new hospital wings, half-price fares, level-crossing removals — every one of those investments is a coordinate on a map of opportunity that will look measurably different by 2030.
For any Victorian thinking about where to buy, where to rent, or whether to move, the practical question is the same one geoscore was built to answer: given everything that's nearby, and everything that's coming, how does this specific address actually score?
Policy speaks in billions. Households, in the end, choose a single address. Closing the gap between those two scales — between Spring Street and the front door — is exactly what amenity mapping, walkability scoring, and transport visualisation are for.
See where you sit on the new map
Search any address on geoscore.com.au and you'll see what's actually walkable from the front door — the trains, schools, parks, shops, clinics and cafes within reach, and how long it takes to get to each. As this budget's projects come online, that picture will shift street by street. Some addresses will be quietly upgraded by a new bus route or an electrified line; others will sit at the centre of a brand-new precinct. Either way, the change is local, and the only way to see it honestly is one address at a time.
The best tool for navigating this budget isn't a spreadsheet. It's a map.